Maps USA Infographic PowerPoint
If you’ve ever needed to show where things happen across the United States — whether it’s customer locations, sales performance by state, population density, or school district boundaries — a clear, professional map-based presentation makes all the difference. That’s exactly what Maps USA Infographic PowerPoint is built for: a clean, ready-to-use template that turns geographic data into compelling visual stories — no design degree required.
What It Is (and What It’s Not)
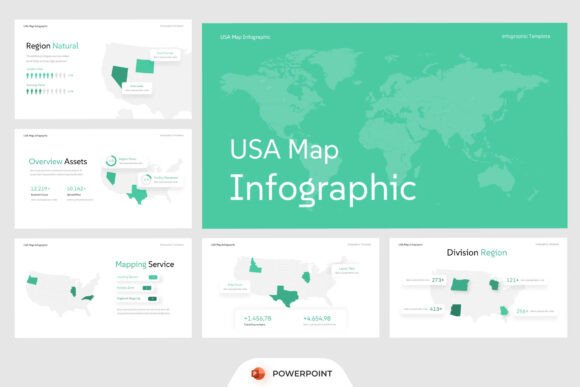
This isn’t just a static image of the U.S. slapped onto a slide. Maps USA Infographic PowerPoint is a fully editable presentation file with thoughtfully designed slides centered around the U.S. map. Each layout supports real-world data storytelling — think shaded regions for market penetration, labeled pins for office locations, color-coded zones for delivery territories, or side-by-side charts comparing regional demographics.
It’s not a stock photo pack or a one-size-fits-all dashboard. There are no pre-filled statistics or locked graphics. Instead, everything — colors, labels, shapes, text, and map elements — is yours to adjust in PowerPoint. You bring the data; this template gives it shape, clarity, and polish.
Why People Reach for This Template
Most users start here because they need to communicate location-based information quickly — but don’t have time to build maps from scratch or hire a designer. Maybe you’re preparing a quarterly review for leadership and want to highlight which states drove the most growth. Or you're a small business owner mapping your first expansion plan and need to visualize service coverage. Perhaps you’re an educator showing migration patterns in a U.S. history class, or a nonprofit tracking community outreach across counties.
The appeal lies in how much it simplifies complexity. Instead of wrestling with GIS software or struggling to align state borders manually, you get accurate, scalable vector-style map visuals — already grouped, labeled, and styled for consistency. The 16:9 widescreen ratio fits modern projectors and screens, and the included free font ensures your text looks sharp and professional, even if you don’t have special fonts installed.
Real-World Uses Across Roles
- Marketers use it to overlay campaign results on a U.S. map — say, social media engagement rates by region — helping spot trends faster than scrolling through spreadsheets.
- Logistics managers plot warehouse locations, delivery routes, or carrier coverage areas to explain capacity limits or identify underserved zones.
- Educators and students build interactive geography projects — like comparing unemployment rates across Midwest states or charting the spread of renewable energy adoption.
- Government and nonprofit teams prepare grant reports showing service reach, funding distribution, or demographic shifts across census tracts — all with consistent, trustworthy visuals.
- Freelancers and consultants deliver polished client decks without rebuilding maps for every new project. One template becomes part of their repeatable workflow.
How Easy Is It Really to Customize?
Very — as long as you’re comfortable using basic PowerPoint tools. All shapes, icons, and text boxes are ungrouped and editable. Want to highlight Texas in gold and dim out the rest? Just select the state and change its fill color. Need to add a new city marker? Insert a circle, label it, and position it precisely. Even the legends and data callouts can be resized, recolored, or reworded in seconds.
The Help Guide included in the package walks you through common edits step-by-step — things like swapping out placeholder stats, adjusting map zoom levels for focus on specific regions (e.g., Pacific Northwest or Southeast), or aligning territory boundaries with your internal sales structure. No coding, no plugins, no learning curve beyond what you already know about copying, pasting, and formatting text.
What’s Inside the Download
You’ll receive a .pptx file with multiple purpose-built slides — not just one map, but variations optimized for different goals: a full U.S. overview, regional breakdowns (e.g., Northeast, South Central), state-level detail slides, comparison layouts, and supporting charts that pair naturally with geographic context.
Also included is a short Help Guide PDF — not a manual, but a friendly, illustrated reference covering how to edit colors, replace sample data, adjust typography, and avoid common formatting hiccups. All fonts used are open-source and embedded, so your deck looks the same whether opened on a Mac, Windows PC, or company laptop.
Things to Keep in Mind Before You Start
First, remember that stock photos or custom illustrations aren’t included — only the editable map framework and layout elements. If your presentation needs photos of cities, landmarks, or people, you’ll source those separately (which keeps file size light and licensing flexible).
Second, while the map outlines are accurate for general use, this isn’t a replacement for precision cartography tools if you need survey-grade boundaries or real-time GPS integration. It’s ideal for presentations, reports, and strategy sessions — not engineering blueprints or legal filings.
Third, consider your audience’s familiarity with maps. A densely labeled slide may overwhelm some viewers. That’s where the template shines: you can simplify by hiding less relevant states, using intuitive color gradients, or pairing the map with a short summary paragraph — all supported by the clean, uncluttered design.
A Practical First Step
Try opening the template and replacing just one data point — like changing “Avg. Income: $62,400” to your actual figure for California — then adjusting the color to match your brand palette. In under two minutes, you’ll see how quickly a generic slide becomes something uniquely useful. That ease-of-use is why so many professionals keep Maps USA Infographic PowerPoint in their go-to toolkit: it saves time, reduces visual guesswork, and helps ideas land clearly — whether you’re pitching to investors or teaching a classroom of high schoolers.
Who Benefits Most?
Anyone who regularly explains “where” alongside “what” or “why.” That includes solopreneurs launching local services, HR teams rolling out regional hiring plans, researchers presenting findings at conferences, or even bloggers illustrating travel trends across U.S. states. You don’t need advanced mapping skills — just a goal, some data, and a desire to make it instantly understandable.
When clarity matters more than complexity, and speed matters more than perfection, this template bridges the gap between raw information and meaningful insight — one well-placed state at a time.