Circle Comparison Infographic PowerPoint
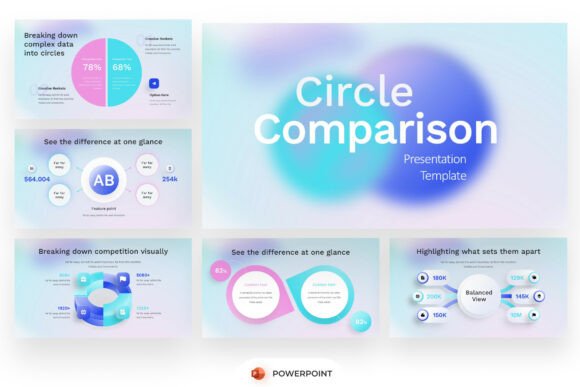
The Circle Comparison Infographic PowerPoint is a purpose-built presentation template focused on visualizing comparative data through circular design elements. It is not a generic slide deck but a structured, editable resource intended for professionals who regularly communicate metrics, benchmarks, or analytical insights—especially where clarity, symmetry, and visual hierarchy matter. Built for Microsoft PowerPoint, it uses a 16:9 widescreen format and relies on soft gradients, abstract glowing accents, and clean circular diagrams to represent relationships between categories, performance indicators, market segments, or strategic goals.
This template does not include stock imagery—the visuals are built from vector-based shapes and layered effects that users can modify directly. All text, colors, sizes, and layout components are fully editable, and the package includes a help guide to support basic customization. A free font is bundled to ensure consistent typographic rendering across devices.
Why Consider This Template?
Professionals evaluating presentation tools often prioritize efficiency, consistency, and visual credibility. The Circle Comparison Infographic PowerPoint responds to specific recurring needs: comparing two or more data points in a way that feels balanced and intuitive; presenting KPIs or survey results without overwhelming audiences with tables or dense charts; and maintaining brand-aligned aesthetics across internal reports or client-facing decks.
Its circular motif supports conceptual framing—such as balance, cycles, interdependence, or holistic assessment—which makes it especially relevant for topics like customer journey mapping, competitive positioning, maturity models, or stakeholder alignment exercises. Unlike linear bar or line charts, circular comparisons emphasize equivalence, proportion, and relational symmetry, which can shift how an audience interprets relative performance.
Key Benefits and Practical Advantages
- Time savings: Pre-designed layouts reduce the need to build comparison diagrams from scratch—particularly useful when deadlines are tight or design resources are limited.
- Visual coherence: Consistent use of gradients, glow effects, and spacing helps unify multi-slide presentations, supporting professional delivery without requiring advanced graphic design skills.
- Flexibility within constraints: While stylistically distinct, the template avoids rigid animations or complex transitions—making it suitable for both live presentations and static PDF exports.
- Accessibility-ready foundations: Clean typography, sufficient contrast in default settings, and logical reading order (when used as intended) support basic accessibility practices—though manual verification remains necessary.
Tradeoffs and Important Considerations
No template eliminates all tradeoffs—and this one is no exception. Because the design emphasizes aesthetic cohesion, some users may find the circular structure less suitable for datasets requiring precise quantitative interpretation (e.g., exact percentage differences or trending over time). Traditional bar charts or scatter plots often convey magnitude and directionality more intuitively than proportional circles, particularly for non-technical audiences.
Also, while all elements are editable, modifying the glow effects or gradient overlays may require familiarity with PowerPoint’s Format Shape options. Users unfamiliar with layering, transparency controls, or color blending may need to consult the included help guide—or allocate time for light learning before full customization.
Importantly, the absence of embedded stock images means users must supply their own photographs, icons, or illustrations if those elements are needed. This preserves licensing control but adds a step for those expecting plug-and-play visuals.
When It Fits Well
The Circle Comparison Infographic PowerPoint is a strong fit in several common scenarios:
- Strategic reviews: When presenting organizational maturity across domains (e.g., “Digital Readiness Across Four Functions”), circular diagrams help signal parity and interconnection rather than hierarchy.
- Market or competitor benchmarking: Comparing feature sets, service coverage, or pricing tiers across three to five players benefits from side-by-side ring diagrams that avoid implying ordinal ranking unless explicitly labeled.
- Internal performance dashboards: Teams tracking quarterly goals across departments—especially where qualitative or semi-quantitative scoring applies—can use the template to highlight relative progress without overemphasizing decimal precision.
- Educational or workshop materials: Trainers using visual metaphors to explain concepts like balanced scorecards, triple bottom line frameworks, or cyclical processes find the circular format conceptually resonant.
When Alternatives May Be More Appropriate
This template is less ideal when the primary goal is statistical rigor or granular trend analysis. For example:
- If your audience expects error bars, confidence intervals, or regression lines, a dedicated data visualization tool (like Excel, Power BI, or Tableau) paired with custom charting will offer greater fidelity and interactivity.
- If your content relies heavily on narrative flow—such as storytelling with sequential case studies or process walkthroughs—a more modular, section-based template may better support pacing and emphasis.
- If branding guidelines strictly prohibit gradients, glows, or rounded forms, adapting this template could require disproportionate effort versus starting with a neutral, minimalist base.
- If team members regularly collaborate in Google Slides or Keynote, native PowerPoint compatibility becomes a logistical factor—not a technical barrier, but one requiring export checks and potential reformatting.
Making an Informed Decision
To determine whether the Circle Comparison Infographic PowerPoint aligns with your needs, ask these questions:
- What is the core message? If comparison is about balance, proportion, or conceptual relationship—not just magnitude—circular visuals add meaning.
- Who is the audience? Internal stakeholders familiar with your organization’s reporting norms may respond well to consistent, branded infographics. External clients or regulators may prefer conventional chart types unless the circular format serves a documented strategic communication goal.
- What is the timeline and skill level? If you need polished slides within hours and have basic PowerPoint proficiency, this template accelerates output. If you’re building a long-term library of reusable assets, consider whether its style scales across future topics—or risks visual fatigue.
- What comes after the presentation? If slides will be converted into handouts, web pages, or training modules, verify that exported versions retain legibility—especially text size and color contrast under different viewing conditions.
Ultimately, the value of the Circle Comparison Infographic PowerPoint lies not in novelty, but in intentionality. It offers a coherent visual language for a narrow but frequent communication challenge: making comparisons feel fair, clear, and grounded—not flashy, but functional. Evaluating it against your actual use case—not aspirational ones—helps avoid mismatched expectations and ensures the time invested in customization yields measurable clarity in delivery.