Four Step Infographic: Modern Workflow Clarity
When explaining a process—whether it’s onboarding new clients, launching a product, refining a marketing funnel, or teaching a classroom concept—the right visual structure makes all the difference. The Four Step Infographic is built for that moment: when clarity, consistency, and visual appeal must work together without compromise. It’s not just another flowchart—it’s a purpose-built, hexagon-based business workflow template designed to reflect how modern teams actually think and operate.
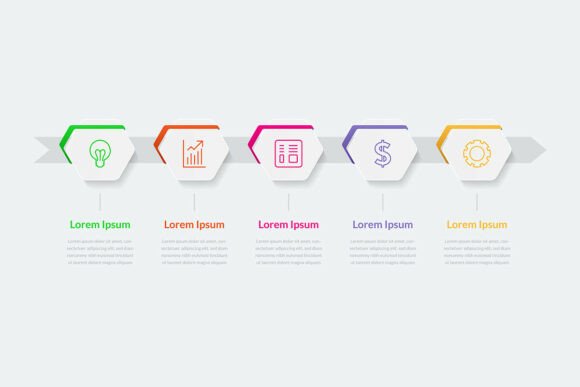
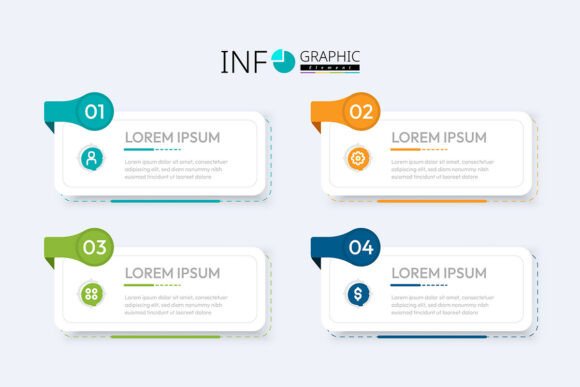
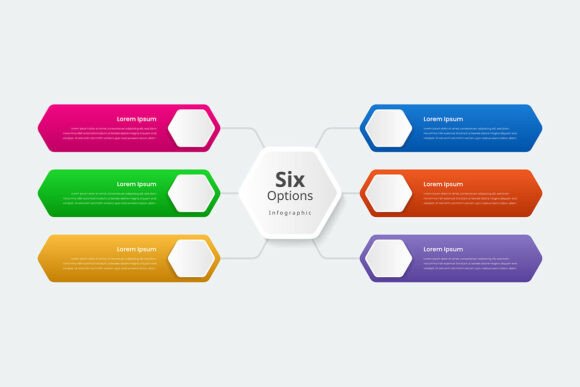
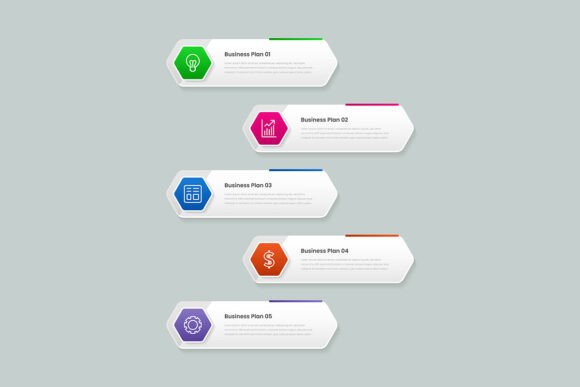
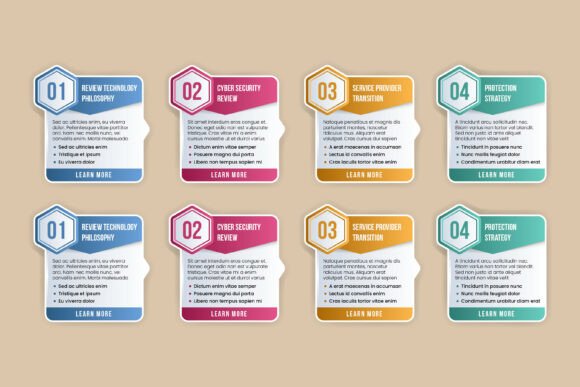
Each of the four steps sits inside a clean, interlocking hexagon—a shape that implies connection, balance, and forward motion. Unlike linear arrows or rigid rectangles, hexagons suggest collaboration and multidirectional influence, making this design especially effective for processes where feedback loops or iterative refinement matter. Icons sit intuitively within each shape, paired with concise text boxes that invite customization—not decoration. That intentional spacing and hierarchy help viewers absorb meaning in under three seconds, a critical advantage in presentations, reports, or digital dashboards.
Why Hexagons Work Better Than Circles or Boxes for Four-Step Processes
Hexagons offer subtle but meaningful advantages over more common shapes. Their six sides provide natural anchor points for labels, icons, and directional cues—no awkward cropping or alignment struggles. In practice, this means you can add supporting annotations (like “Time required” or “Owner”) along outer edges without crowding the core message. Designers and educators consistently report that audiences perceive hexagon-based infographics as more dynamic and memorable than circular or square alternatives—especially when explaining cyclical or interdependent workflows like agile sprints, customer journey stages, or quality assurance pipelines.
For example, a freelance UX researcher might use this Four Step Infographic to map a user testing cycle: Recruit → Observe → Analyze → Iterate. The hexagonal layout visually reinforces that “Iterate” feeds back into “Recruit,” avoiding the artificial finality of a one-way arrow. That nuance matters—not as design theory, but as accurate communication.
Real-Time Editing Without Compromise
This isn’t a static JPG you’ll need to rework in Photoshop every time your messaging shifts. Every element—text, icon, color, and shape—is fully editable in Adobe Illustrator (.Ai), EPS, and SVG formats. That means changing a headline font to match your brand guidelines takes seconds, not hours. Swapping an icon to better reflect your industry (e.g., replacing a generic “gear” with a “microscope” for lab workflows) requires no external assets—just drag, replace, and scale. Even the color palette is layered logically: base tones are grouped separately from accents, so updating your entire infographic to align with a new campaign palette is a five-click task.
That level of control saves tangible time. A small business owner preparing investor materials last-minute doesn’t need to hire a designer to adjust step two’s description. A university lecturer adapting the same visual for three different course modules doesn’t need to manage three separate files. The Four Step Infographic supports iteration—not just presentation.
High-Resolution Output Where It Counts
Printed handouts, large-format posters, and high-DPI digital displays demand precision. This file delivers at 300 DPI across all raster outputs (JPG included), ensuring crisp rendering whether it’s projected in a boardroom or printed as a double-page spread in an annual report. And because all graphics are 100% vector-based, scaling up for a tradeshow banner introduces zero pixelation or edge fuzziness—unlike PNGs or low-res stock illustrations.
Still, it’s worth noting: while the SVG version works beautifully in web contexts (think embedded explainer graphics in Notion docs or internal wikis), complex animations or interactive hover states would require additional development. This is a foundation—not a full application. Use it to communicate clearly first; extend functionality only if your audience truly needs it.
Who Benefits Most—and Why
Marketing professionals use this to visualize funnel stages without oversimplifying complexity—say, mapping awareness → consideration → conversion → retention with distinct KPIs per hexagon. Educators and trainers appreciate how easily the structure adapts to pedagogical models: Engage → Explore → Explain → Extend fits seamlessly, and the visual rhythm helps learners retain sequence and relationships. Freelancers and consultants rely on it to standardize service scoping decks—clients grasp scope, timeline, deliverables, and review cycles at a glance, reducing back-and-forth emails.
It’s less ideal for highly technical processes requiring nested substeps (e.g., software deployment with 12+ conditional branches) or for audiences needing strict regulatory compliance visuals (where ISO-standard flowchart symbols may be required). In those cases, pairing this Four Step Infographic with supplementary documentation—or choosing a more granular template—makes sense.
Thoughtful Integration, Not Just Drop-In Use
The most effective users treat this as a thinking tool—not just a design asset. Before inserting text, they ask: What’s the *one thing* each step must communicate? Which icon best signals action versus outcome? Does the color progression support the narrative (e.g., cool-to-warm hues suggesting progression, or consistent saturation for equality among steps)? Because the file is well organized—with layers named logically and grouped by function—these decisions stay visible and reversible.
One small business owner shared how using consistent hexagon colors across her team’s quarterly planning decks helped remote staff quickly identify which strategic pillar each initiative supported—even before reading the text. That kind of subconscious alignment doesn’t happen with generic templates. It emerges from deliberate, editable structure.
What’s Included—and What That Means for Your Workflow
Your download includes native Illustrator (.Ai), cross-compatible EPS, universally viewable JPG, and web-ready SVG files. No hidden fonts or locked layers. No rasterized effects masquerading as vectors. You get what’s described: editable, scalable, resolution-agnostic assets ready for immediate use. If you hit a snag—say, an unexpected clipping mask in your version of Illustrator or confusion about layer naming—support is responsive and practical, not automated. Real humans troubleshoot real issues, because clarity shouldn’t stop at the visual.
In a landscape crowded with decorative clipart and overdesigned templates, the Four Step Infographic stands out by honoring substance over sparkle. It doesn’t shout. It clarifies. And in professional communication—where attention is scarce and trust is earned—that quiet precision is the rarest advantage of all.