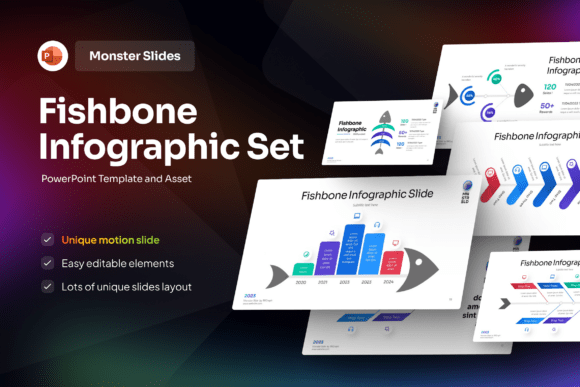
Fishbone Infographic PowerPoint Template
If you’ve ever stared at a messy whiteboard covered in arrows, sticky notes, and half-formed theories after a team brainstorm—only to realize no one remembers which cause connects to which effect—you’re not alone. That’s exactly why the Fishbone Infographic PowerPoint Template exists: to turn tangled problem-solving sessions into clear, visual, presentation-ready stories.
This isn’t just another slide deck with clip art. It’s a purpose-built framework for root cause analysis—structured like the classic Ishikawa (or fishbone) diagram—but designed for real-world use in modern workplaces. Think of it as your visual translator: it takes ambiguity, complexity, and cross-departmental confusion and turns them into something you can walk into a meeting with, present confidently, and act on immediately.
Where It Fits in Real Work—Not Just Theory
The power of the Fishbone Infographic PowerPoint Template shines brightest when things go sideways—and they often do. A manufacturing line slows down? Customer complaints spike unexpectedly? A new software rollout stalls because users keep abandoning the onboarding flow? These aren’t abstract case studies. They’re Tuesday afternoon problems that need clarity—not more jargon.
In healthcare, quality improvement teams use this template during safety huddles to map out why medication errors increased last quarter—grouping causes under categories like “Staff Training,” “Workflow Design,” or “System Alerts.” In education, curriculum designers apply it to understand why student engagement dropped in hybrid learning modules—breaking variables into “Tech Access,” “Instructional Clarity,” “Peer Interaction,” and “Assessment Feedback.”
Marketing managers have used it to diagnose a sudden dip in conversion rates: was it the landing page copy? The ad targeting? The timing of the campaign? With editable branches and clean category headers, the template helps separate assumptions from evidence—before decisions get made.
Who Benefits—and How They Use It Differently
Project managers treat the Fishbone Infographic PowerPoint Template like a collaborative checkpoint. Instead of presenting a finished conclusion, they drop the blank diagram into a workshop and guide stakeholders through co-creating causes in real time. Because every shape, label, and connector is fully editable, there’s no need to redraw anything post-meeting—just save, tweak, and share.
Trainers and L&D professionals rely on it to simplify complex frameworks—like Lean Six Sigma or PDCA cycles—for new learners. Rather than describing “inputs vs. process controls vs. environmental factors” verbally, they show it visually. One client told us their sales onboarding time dropped 30% after switching from bullet-point slides to interactive fishbone walkthroughs—because trainees finally *saw* how each step connected to outcomes.
Small business owners appreciate how little setup it requires. No design skills needed. No stock image subscriptions. Just open the file, type in your issue at the “head” of the fish (e.g., “Late Deliveries”), pick six root categories that make sense for your context (they’re customizable—not locked to the traditional “6 Ms”), and start filling in causes. Even if you only use three branches instead of six, it still works. Flexibility is built-in—not bolted on.
What Makes It Click—Beyond Just Being Editable
Yes, it’s fully editable. Yes, it includes a free font and uses a widescreen (16:9) ratio so it looks sharp on any laptop or conference room screen. But what truly sets the Fishbone Infographic PowerPoint Template apart is its balance of structure and simplicity.
It doesn’t force you into rigid academic categories. You’re not stuck with “Man, Machine, Material, Method, Measurement, Mother Nature.” If you run a creative agency, your branches might be “Client Brief Clarity,” “Team Capacity,” “Feedback Loops,” “Tool Integration,” “Timeline Realism,” and “Scope Definition.” The template supports your logic—not the other way around.
And because it ships with a help guide (not buried in fine print, but clearly labeled and practical), even someone who opens PowerPoint twice a year can figure out how to swap colors, adjust spacing, or export a single slide as a PNG for a quick Slack update.
Things to Keep in Mind Before You Dive In
Like any tool, the Fishbone Infographic PowerPoint Template works best when matched to the right moment—and managed with realistic expectations.
First: it’s a visualization aid, not a magic fix. It won’t uncover root causes on its own. You still need input from people who actually do the work—the nurse who documents errors, the warehouse associate who loads the trucks, the support agent who hears the same complaint daily. The template organizes insight—it doesn’t generate it.
Second: while all images are editable, stock photos aren’t included. That’s intentional. It keeps the file lightweight and avoids licensing surprises. Most users simply insert their own screenshots, org charts, or workflow diagrams—or leave visuals minimal and let the structure speak for itself.
Third: don’t overcomplicate the first draft. Early versions often fail not from poor design, but from trying to capture *everything*. Start with three or four high-impact causes per branch. Refine later. A clean, focused fishbone beats a cluttered one every time—even in a boardroom.
When Simpler Is Smarter
Some teams try to build fishbone diagrams in Excel or Google Slides from scratch—spending hours aligning text boxes and adjusting arrow angles. Others reach for expensive diagramming tools that require training and ongoing subscriptions. The Fishbone Infographic PowerPoint Template sidesteps both traps.
It assumes you already have PowerPoint (or Google Slides via export). It assumes you care more about speed and clarity than pixel-perfect animation. And it assumes you’d rather spend 20 minutes refining insights than 90 minutes fighting formatting.
One operations lead shared how her team cut retrospective prep time in half after switching to this template—freeing up energy to test solutions instead of reformatting slides. Another nonprofit used it to map barriers to donor retention, then turned the final slide into a one-page handout for their board. No extra tools. No design handoffs. Just direct, actionable communication.
That’s the quiet strength of the Fishbone Infographic PowerPoint Template: it doesn’t shout. It clarifies. It doesn’t replace thinking—it makes thinking visible, shareable, and hard to ignore.