Rocket Infographic PowerPoint: Turning Strategy Into Visual Momentum
When you're pitching a bold idea, mapping a complex growth phase, or aligning your team around a new product launch, words alone rarely cut it. What moves people—and investors—is clarity wrapped in confidence. That’s where Rocket Infographic PowerPoint steps in—not as just another slide deck, but as a strategic storytelling engine built for startups and growth teams who refuse to settle for static presentations.
More Than a Theme—It’s a Narrative Framework
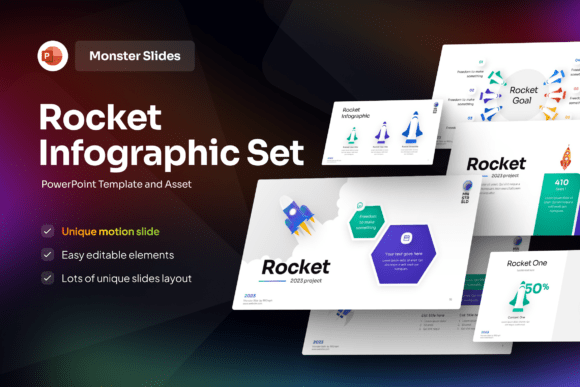
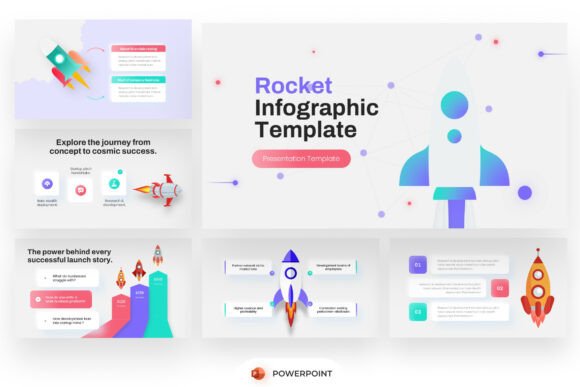
The rocket motif isn’t decorative fluff. It’s functional symbolism. A rocket represents acceleration, trajectory, calculated risk, and measurable lift-off—all core themes in early-stage business development. Rocket Infographic PowerPoint leverages that visual language intentionally: each infographic element—from ascending milestone charts to staged launch timelines—reinforces progress, not just process.
Unlike generic templates that force your message into rigid, one-size-fits-all layouts, this template offers structure *with flexibility*. You’ll find slides designed for specific moments in your journey: a “Pre-Launch Readiness” dashboard, a “Growth Engine Loop” diagram showing acquisition, activation, and retention in motion, or a “Funding Milestone Roadmap” with customizable stages and KPIs. These aren’t placeholders waiting for content—they’re scaffolds built for real-world startup logic.
What Makes It Work in Real Presentations?
Three things separate Rocket Infographic PowerPoint from the rest of the crowded template market: purpose-built design, frictionless customization, and workflow-aware architecture.
Purpose-Built for High-Stakes Scenarios
- Startup Pitches: Investors skim fast. With Rocket Infographic PowerPoint, your problem-solution fit lands on Slide 2—not Slide 7—using visual metaphors like “market gap” arrows and “solution velocity” bars that communicate scale and urgency at a glance.
- Internal Roadmaps: When presenting a 12-month product rollout to engineering and marketing leads, the “Phase-Driven Launch Timeline” slide lets you layer technical dependencies, marketing campaigns, and customer feedback loops—all on one clean, chronological canvas.
- Growth Analysis Reports: Instead of burying metrics in dense tables, use the “Performance Thrust Dashboard”—a radial chart + bar combo that highlights which levers (e.g., CAC reduction, referral rate lift) are generating actual upward momentum.
Fully Editable—Without the Headaches
“Editable” means different things across platforms. Some templates claim full editability but lock fonts, distort icons when resized, or require external software to tweak colors. Rocket Infographic PowerPoint delivers true control: every shape, icon, text box, and chart is native to PowerPoint. No embedded objects. No hidden layers. No font licensing surprises—because it ships with a free, modern, legible font included right in the package.
You can change a rocket’s trajectory angle to reflect revised Q3 goals. Swap out a “Beta Testing” stage for “Regulatory Review” without breaking alignment. Adjust color gradients to match your brand’s dark mode guidelines—all within seconds. That kind of agility matters when you’re iterating between investor feedback rounds or prepping for an executive offsite.
How It Fits Into Modern Startup Workflows
Today’s founders don’t build decks in isolation. They collaborate across Notion, Figma, and Slack—pulling data from Mixpanel, updating timelines in ClickUp, and validating assumptions in user interviews. Rocket Infographic PowerPoint doesn’t try to replace those tools. Instead, it serves as the *final synthesis layer*: the place where all that fragmented input becomes a coherent, persuasive narrative.
For example, a founder might pull conversion funnel stats from Google Analytics, drop them into the “Growth Funnel Infographic,” then overlay qualitative insights (“Users abandon cart at shipping estimate step”) using the built-in annotation callouts. The result? A single slide that tells both the quantitative and human story—without needing supplemental handouts or verbal caveats.
Marketing teams use it to visualize campaign sequencing: email nurture → webinar → demo request → trial activation. Engineering leads adapt the “Sprint Launch Sequence” layout to show how backend API upgrades enable frontend feature releases. Even non-technical stakeholders—like legal or finance—find value in the “Compliance & Scaling Timeline,” where regulatory checkpoints sit alongside hiring and infrastructure milestones.
Practical Benefits You’ll Notice Immediately
- Time Saved: Average users report cutting deck prep time by 40–60% compared to building from scratch—especially for recurring formats like quarterly reviews or investor updates.
- Consistency Without Rigidity: Maintain brand-aligned visuals across multiple presenters (sales, product, CEO) while allowing each to emphasize what matters most to their audience.
- Confidence in Delivery: When your slides visually reinforce your message—rather than distract from it—you speak with more authority. Audiences remember rockets rising; they forget bullet-point lists.
- No Stock Image Surprises: All graphics are original vector-based illustrations—no placeholder “image not included” warnings or awkward cropping. (Note: stock photography isn’t bundled—but that’s intentional. It keeps file size lean and gives you full control over visual authenticity.)
Who Should Reach for Rocket Infographic PowerPoint—And Why Timing Matters
This isn’t a “nice-to-have” for polished decks. It’s a tactical advantage for specific inflection points:
- Right before a seed funding round: When every minute of investor attention counts, a clear, energetic visual narrative builds credibility faster than dense financial appendices.
- During product-market fit validation: Use the “Adoption Velocity Chart” to show how cohort behavior shifts across weeks—not just months—highlighting early signals of traction.
- When scaling cross-functionally: Sales needs to understand engineering timelines. Customer success needs to anticipate feature release impacts. Rocket Infographic PowerPoint bridges those gaps visually.
- Preparing for pitch competitions or accelerators: Judges see hundreds of decks. Standing out isn’t about flash—it’s about focus. This template helps you lead with intention, not decoration.
Smart Customization Starts With Structure
Don’t start by changing colors or fonts. Start by choosing the right slide type for your goal. Is this about progress? Use the milestone ladder. About cause and effect? Try the “Growth Catalyst Flow.” Mapping dependencies? The interconnected orbit diagram works better than a standard flowchart.
The included Help Guide Files walk through these decisions—not as rigid rules, but as pattern recognition aids. You’ll learn how to repurpose a “Team Launch Roles” slide into a “Partner Integration Map,” or convert a “Tech Stack Evolution” graphic into a “Customer Journey Layering” visual. It’s less about learning software, and more about learning how to think in layers, sequences, and systems.
Final Thought: Clarity Is the First Milestone
Innovation isn’t measured in slides delivered—it’s measured in decisions made, resources unlocked, and momentum gained. Rocket Infographic PowerPoint exists to remove friction between insight and action. It won’t write your strategy—but it will make sure your strategy is seen, understood, and remembered. Because when your next presentation isn’t just informative, but unforgettable, that’s when real lift-off begins.