Isometric Technology Infographic Concept
If you’ve ever scrolled through a polished tech report, a startup’s investor deck, or a SaaS brand’s explainer page and paused—not because of the text, but because the visuals *clicked*—chances are you were looking at an isometric illustration set done right. The Isometric Technology Infographic Concept isn’t just another icon pack. It’s a cohesive visual language built for clarity, depth, and quiet confidence—where data feels tangible, systems feel navigable, and complexity feels approachable.
A Design Language Built for Depth—Without Clutter
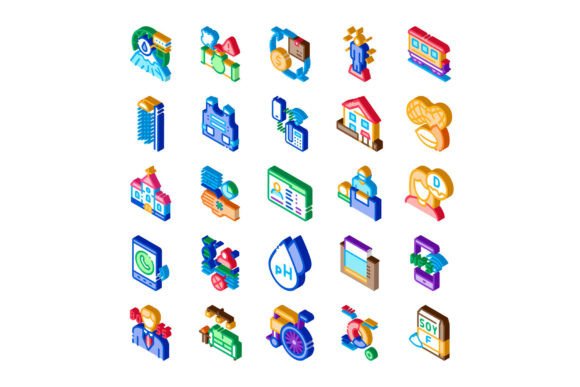
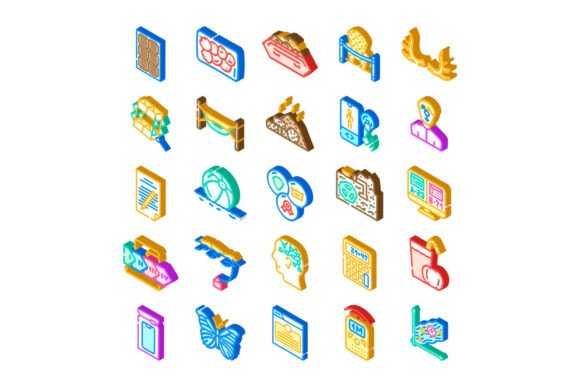
At its core, this concept uses isometric projection: a 3D-like perspective drawn in 2D space, where all three axes are equally foreshortened and angles stay consistent (typically 30°). But what sets it apart isn’t just geometry—it’s intentionality. Each icon—whether it’s a cloud server rack, a network node, a dashboard chart, or a handshake between abstract avatars—is crafted with uniform line weight, subtle shadow cues, and restrained color readiness (think flat palettes that scale cleanly across light/dark modes). There’s no forced realism, no skeuomorphic clutter. Just clean volume, spatial logic, and purposeful negative space.
This isn’t decorative. It’s functional storytelling. When your audience sees an isometric workflow diagram showing data flowing from IoT sensors to AI models to real-time dashboards, they don’t just *see* steps—they *grasp* relationships. That’s the personality: calm authority, technical fluency, and human-centered precision. It avoids the cold sterility of some tech visuals and the oversimplified cuteness of others. It meets professionals where they are: time-pressed, detail-aware, and visually literate.
Where It Fits—and Where It Doesn’t
The Isometric Technology Infographic Concept shines brightest when visual hierarchy matters more than ornamentation. Think: executive summaries for enterprise clients, onboarding flows for B2B software, annual sustainability reports with embedded metrics, or even podcast show notes that use icons to break down complex topics like blockchain consensus or edge computing.
It works exceptionally well in digital contexts—SVG-based assets scale flawlessly across responsive web design, social media graphics (especially LinkedIn carousels and Twitter/X threads), and interactive dashboards. Print applications hold up too: annual reports, pitch decks printed for board meetings, or conference handouts where crispness and legibility at small sizes matter. Because the forms are simplified but structurally sound, they remain readable even at 16px in a dense infographic legend.
Where it pulls back? In highly emotive or narrative-driven spaces—like children’s edtech apps, lifestyle branding, or handwritten-style newsletters. It’s not a script font or a playful sans serif. It’s a tool for structure, not sentiment. That’s not a limitation—it’s focus.
More Than Icons: A System for Consistency
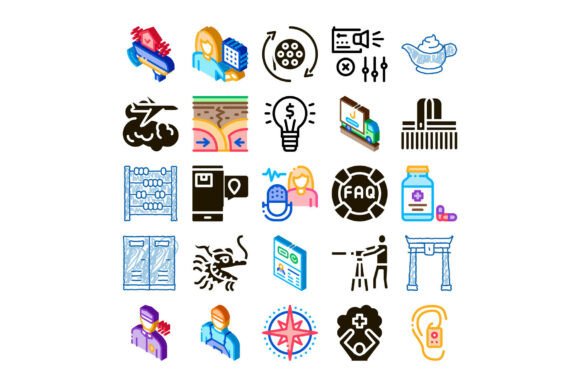
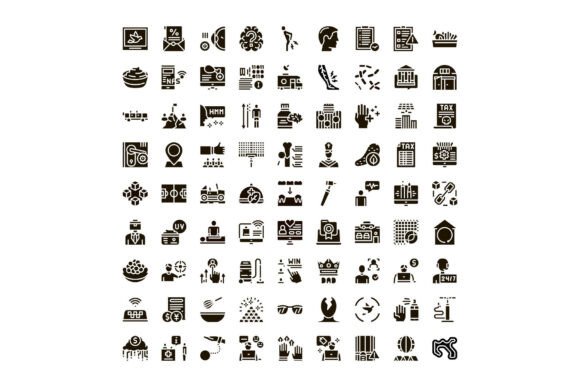
What makes this concept truly valuable for designers and small business owners isn’t just the individual icons—it’s how they work *together*. The set includes variations: outline-only, filled, dual-tone, and layered versions (e.g., a server icon with optional “active” status dots or connection lines). This means you’re not stuck recoloring or redrawing to show state changes—you’re composing with intention.
For marketers building a brand identity, that consistency becomes part of the voice. Using the same isometric rhythm across your website hero section, your email header graphics, and your webinar slide deck builds subconscious recognition. Your audience doesn’t need to read your logo to sense it’s *you*—they feel the visual cadence.
And because the style avoids trendy gradients or heavy shadows, it ages gracefully. A 2023 investor deck using this concept will still look professional in 2027—no redesign panic required. That’s rare in fast-moving digital spaces.
Practical Tips Before You Implement
Before dropping these into your next project, ask yourself three things:
- Does the context demand explanation—or emotion? If you’re simplifying a fintech API integration flow, yes. If you’re launching a wellness app with a warm, personal tone, consider pairing one or two key isometric elements with softer supporting visuals instead of going full set.
- How much customization do you actually need? Many users assume they’ll tweak every icon. In practice, the strongest results come from using the assets as designed—then adjusting only color, spacing, or grouping. Over-editing breaks the system’s cohesion.
- What’s your output environment? These icons are optimized for digital-first use. If you’re doing large-format print (e.g., trade show banners), confirm the vector files include high-res EPS or PDF exports—not just SVGs meant for screen rendering.
Test readability early: place a group of icons beside body copy at 100% zoom on both desktop and mobile. Do labels stay legible without squinting? Does the visual weight compete with or support your text? If icons drown out your message, reduce count—not size.
Licensing, Flexibility, and Real-World Use
This is a commercial font and design asset—meaning it’s licensed for use in client work, products you sell, and internal brand materials. No hidden restrictions around SaaS platforms or subscription services, which matters if you're a developer or agency embedding visuals into white-labeled tools.
You’ll typically get multiple file formats (SVG, PNG, AI, Figma-compatible JSON), plus documentation on recommended grid spacing, alignment baselines, and accessible contrast ratios for text overlays. Some versions include ready-to-use infographic templates—great for bloggers or solopreneurs who need to ship high-quality visuals fast without hiring a designer.
One underrated strength? Its neutrality toward specific industries. While rooted in tech, the visual grammar translates cleanly to healthcare data systems, smart city planning, or even green energy infrastructure—because it speaks in relationships, not jargon.
In short: the Isometric Technology Infographic Concept earns its place not by being flashy, but by being dependable. It’s the kind of design asset you reach for when you need to communicate something complex—without making it feel complicated.