Carbon Footprint Infographic Elements
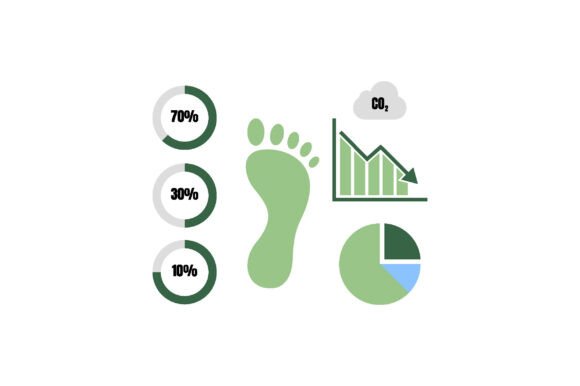
Carbon Footprint Infographic Elements is a purpose-built visual toolkit—designed not for decoration, but for clarity, consistency, and strategic communication. It’s a set of modular, editable components: icons representing energy use, transport modes, waste streams, renewable sources, and emissions metrics—all grounded in real-world climate data and aligned with widely accepted carbon accounting frameworks (like GHG Protocol Scope 1–3 categories). What makes it distinct isn’t just its clean, fresh aesthetic—it’s how intentionally each element supports decision-making, storytelling, and action.
Why This Toolkit Fits Real Work—Not Just Presentations
For entrepreneurs launching sustainability initiatives, educators simplifying complex environmental concepts, or marketers building brand credibility around climate responsibility—this isn’t about making slides prettier. It’s about reducing cognitive load while increasing precision. When your audience sees a standardized, color-coded transport icon paired with verified emission ranges (e.g., “100 km by diesel car ≈ 14 kg CO₂e”), they grasp scale and trade-offs faster than reading paragraphs of context.
The JPG, AI, and EPS formats serve different stages of use: JPG for quick embedding into reports or social posts; AI and EPS for deep customization—recolouring entire sections to match brand palettes, adjusting icon proportions for responsive layouts, or isolating individual elements to annotate with project-specific data. Because all 100 elements are fully editable, you’re not locked into someone else’s hierarchy or assumptions. You decide whether the “food system” module emphasizes plant-based shifts, supply chain transparency, or food waste reduction—based on your audience’s priorities, not generic defaults.
Strategic Use Starts With Intention—Not Aesthetics
Before opening the file, ask: What decision do I want this to support? That question separates effective use from decorative clutter. A small business owner comparing fleet electrification options might isolate the vehicle icons, recolour them by fuel type, and layer in local electricity grid emissions intensity to model real-world savings. An educator building a lesson plan might combine the “home energy” and “behavior change” elements to visually contrast baseline usage with impact of specific actions—like switching to LED lighting or lowering thermostat settings.
This level of intentionality transforms Carbon Footprint Infographic Elements from a design asset into a planning tool. It surfaces assumptions: if your infographic shows “recycling” as a dominant solution but omits upstream reduction or reuse pathways, the visual hierarchy may unintentionally reinforce outdated narratives. Editing isn’t just about swapping colors—it’s about auditing emphasis, sequence, and omission.
When Simplicity Serves Strategy—And When It Doesn’t
A clean, minimal look works because it removes noise—not because simplicity is inherently virtuous. In stakeholder briefings where technical accuracy matters, pairing an editable bar chart element with source citations and uncertainty ranges (e.g., “±12% due to regional grid variability”) adds rigor without sacrificing readability. In contrast, oversimplifying—like using a single “green leaf” icon to represent all carbon offsets—risks misrepresenting additionality, permanence, or verification standards.
Consider timing. Launching a sustainability report? Use the editable timeline element to map milestones against emissions baselines—not just aspirational targets. Planning internal training? Combine the “energy audit” and “behavioral levers” modules to show staff exactly where their daily choices intersect with organizational goals. The flexibility of RGB color editing means you can align visuals with existing brand guidelines *and* signal meaning: consistent use of amber for “transition phase” actions, green for “implemented”, and grey for “not yet scoped” creates intuitive navigation without text overload.
Practical Editing Decisions That Shape Impact
- Color strategy matters more than palette preference. Don’t recolour just to match your logo—assign meaning. Use hue shifts to indicate progress (e.g., light-to-dark blue for increasing renewable share) or risk (red-to-orange for rising Scope 3 exposure).
- Scale communicates priority. In AI or EPS, resize elements deliberately. Making the “supply chain emissions” icon larger than “office electricity” signals where operational leverage truly lies—even if both are present.
- Contextual annotations beat decorative flourishes. Add short, sourced labels directly onto editable layers: “Based on 2023 UK DEFRA conversion factors” or “Excludes embodied carbon in construction”. These notes build trust far more than ornate borders ever could.
- Test for interpretability—not just aesthetics. Show a draft to someone unfamiliar with your project. If they misread a flow diagram or assume correlation implies causation, revise the element relationships—not just the fonts.
Risks of Using Without Grounding
Carbon Footprint Infographic Elements becomes counterproductive when treated as a shortcut rather than a scaffold. Dropping pre-made icons into a pitch deck without verifying underlying assumptions—like applying global average emission factors to a hyperlocal initiative—can erode credibility fast. Similarly, reusing the “renewable energy” icon across contexts without specifying source (solar PV vs. wind vs. grid-mix certified RECs) blurs critical distinctions that affect both impact measurement and stakeholder perception.
Another subtle risk: visual fatigue. Because the elements are so easy to edit, it’s tempting to generate many variants quickly—then deploy them inconsistently across channels. A mismatched color meaning in a blog post versus a printed brochure confuses audiences and dilutes messaging discipline. The solution isn’t fewer edits—it’s documented editing guidelines: a one-page internal reference that defines what each color, icon size, and layout convention signifies across your organization.
Long-Term Value Lies in Iteration—Not Initial Perfection
The most valuable users of Carbon Footprint Infographic Elements treat it as a living system—not a static download. They track which combinations resonate most with specific audiences (e.g., investors respond better to stacked bar charts showing emissions by category over time; community groups engage more deeply with illustrated “before/after” household scenarios). They archive versions, note what changed and why, and revisit assumptions annually as data sources evolve.
This approach builds institutional memory. A freelancer who maintains a personal library of edited variations—annotated with client goals and outcomes—develops sharper intuition about which elements accelerate understanding versus which require deeper explanation. A school district that adapts the “school transport” module year after year, incorporating new route data and student survey feedback, turns a design file into a longitudinal learning tool.
Getting Started—Without Overcommitting
You don’t need to overhaul every communication at once. Start small: pick one recurring deliverable—a quarterly impact summary, a grant application section, or a team onboarding slide—and replace one static graphic with an editable Carbon Footprint Infographic Elements version. Focus first on accuracy: verify the numbers behind each icon, cite sources visibly, and define scope clearly (“This includes employee commutes but excludes business travel”). Then refine for clarity: adjust spacing, test color contrast for accessibility, simplify labels without losing nuance.
As confidence grows, layer in complexity: link editable charts to live data feeds via embedded SVG code, or combine multiple elements into custom workflows (e.g., mapping supplier engagement efforts against their reported Scope 1 emissions). The formats—JPG for speed, AI/EPS for depth—mean you scale effort to outcome, not the other way around.
Ultimately, Carbon Footprint Infographic Elements earns its place not by how many files you own, but by how thoughtfully you deploy them—to clarify trade-offs, align teams, surface hidden assumptions, and make sustainability tangible. That’s how clean design becomes strategic leverage.